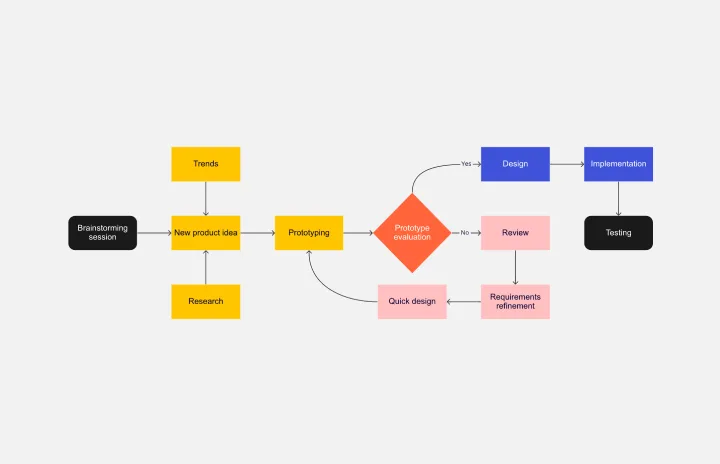
The complexity of modern business and technical processes is increasing exponentially. This means that simplifying, understanding, and communicating these processes has never been more essential.
One of the most tried-and-true tools in the toolkit of any project manager, business analyst, or process designer is the humble flowchart. Here, we’ll guide you on mastering the art of process visualization using flowcharts. If you need some help why don’t you check out our personal recommendation: zenflowchart.com? It’s a great start!
The Power of Flowcharts
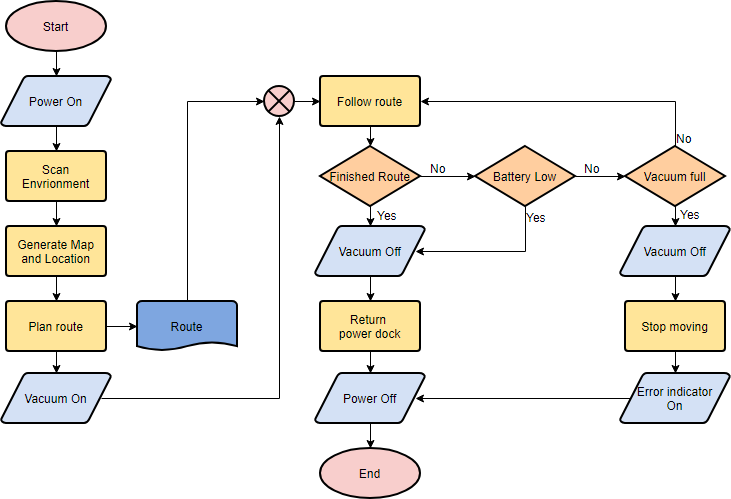
Delving into the mechanics, we have to appreciate the underlying value of flowcharts.
Simplicity from Complexity
At their core, flowcharts translate multifaceted processes into understandable visuals.
Bridging Communication Gaps
Whether it’s a technical or non-technical audience, flowcharts help ensure everyone’s on the same page.
Supporting Decision Making
When businesses need to decide on process changes or improvements, flowcharts can be invaluable.
The Basics
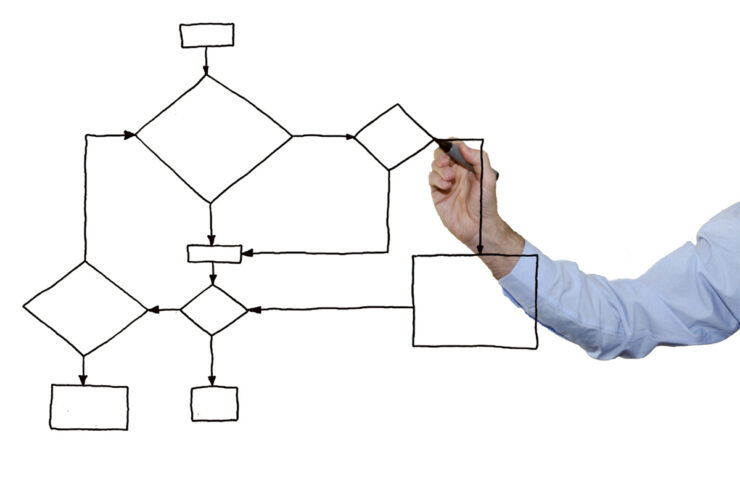
Like any tool, the effectiveness of a flowchart depends on how it’s used. Here’s a foundational understanding:
- Start and End Points: Every process has a beginning and an end. These are usually represented by oval shapes.
- Process Steps: Rectangles denote specific tasks or operations. This is where the action takes place.
- Decision Points: Diamonds indicate decisions. They typically represent a question with two or more outcomes, guiding the next steps in the process.
- Flow Lines: Arrows connect the various elements, guiding the viewer’s eye and indicating the sequence of steps.
Choosing the Right Type
Depending on the nature and complexity of the process, different types of flowcharts can be more effective:
- Process Flowchart: A high-level representation, often used to depict business processes.
- Workflow Chart: Highlights the sequence of tasks and who is responsible for each.
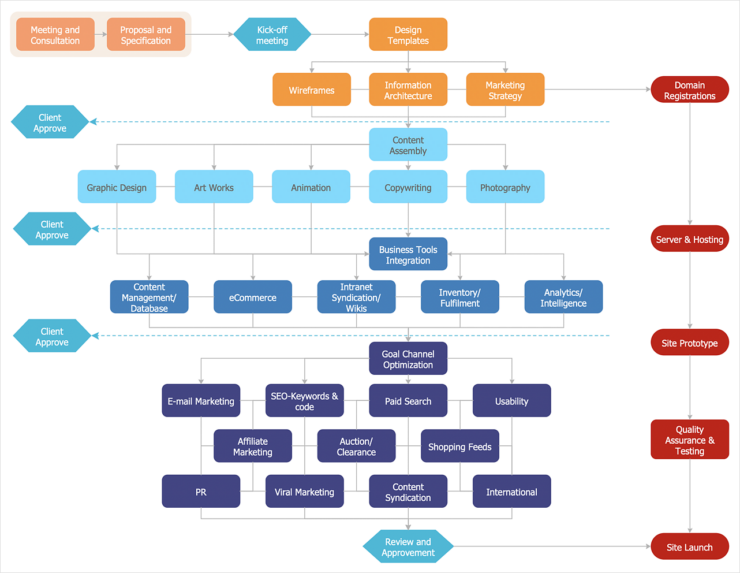
- Swimlane Flowchart: Divides tasks by departments or team members. Each ‘lane’ represents a different entity’s responsibilities.
- Data Flowchart: Focused on information flow, these charts depict how data is processed and transferred.
- Cross-Functional Flowchart: A matrix-based approach to represent relationships between process steps and organizational units.
Understanding your goals and audience will help determine the most appropriate flowchart type.
Crafting a Compelling Flowchart
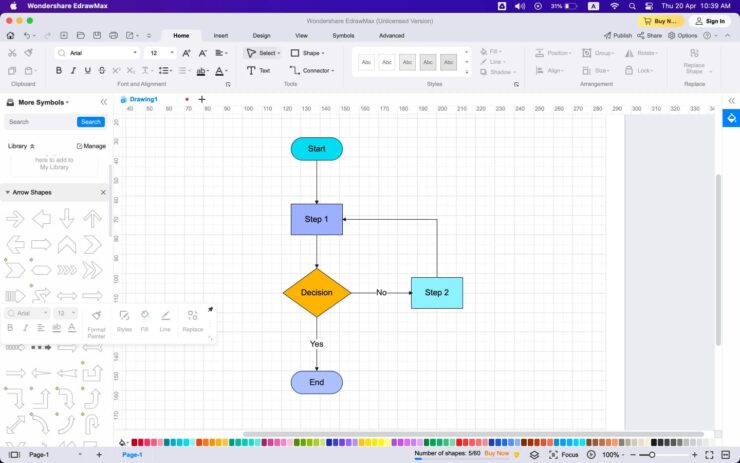
Creating a flowchart isn’t just about throwing shapes onto a canvas. It’s an art. Here are some steps to ensure your flowchart is clear and effective:
- Define the Scope: Determine the starting and ending points. Understand the boundaries of what you’re visualizing.
- Brainstorm with a Team: Gather insights. Whether it’s with sticky notes or a digital tool, engage multiple perspectives.
- Lay Out the Major Steps: Before diving deep, understand and lay out the primary actions or decision points.
- Fill in the Details: Now, flesh out the specifics. Remember to keep it as simple as necessary, but no simpler.
- Use Consistent Symbols: This isn’t the time to get overly creative. Stick with standard symbols unless there’s a compelling reason to deviate.
- Prioritize Clarity: Use labels, keep spacing consistent, and avoid crossing lines when possible.
- Test Your Flowchart: Ask someone unfamiliar with the process to interpret your flowchart. Their feedback can be invaluable.
Common Pitfalls to Avoid

While flowcharts can simplify complexity, creating them isn’t without challenges. Be wary of:
- Over-complicating: Flowcharts are meant to clarify, not confuse. Avoid cramming too much information into a single diagram.
- Oversimplifying: While brevity is good, missing key steps can mislead viewers and render the chart ineffective.
- Ignoring Feedback: Constructive criticism is crucial. Iteration can transform a good flowchart into a great one.
- Not Keeping It Updated: Processes evolve. Ensure your flowcharts do too.
Creating the Perfect Flowchart
While mastering flowcharting is invaluable, remember it’s one tool among many. As processes become more complex, you might explore other visualization methods, like mind maps, Gantt charts, or UML diagrams. Each has its unique strengths, depending on the context.
| # | Tip/Trick | Description |
| 1 | Start with a Clear Objective | Before sketching or selecting tools, define the purpose of your flowchart. Determine what you want the viewer to learn or understand by the end. |
| 2 | Choose the Right Symbols | Familiarize yourself with standard flowchart symbols: Ovals for Start/End, Rectangles for Processes, Diamonds for Decisions, Parallelograms for Input/Output, Arrows for Flow Direction. Using recognized symbols prevents confusion. |
| 3 | Keep It Simple | Avoid cramming too much information. Consider breaking complex flowcharts into multiple diagrams. Create an overview flowchart for detailed processes and then use sub-flowcharts for specific parts. |
| 4 | Follow a Logical Flow | Ensure it has a distinct start and finish point. Use arrows wisely to guide the viewer step-by-step with a clear narrative flow. |
| 5 | Use Colors Strategically | Use colors to denote phases, teams, or action types. Ensure that it remains legible in grayscale for accessibility and readability. |
| 6 | Group Related Steps | Use ‘swimlanes’ to group related steps based on responsible departments or teams. |
| 7 | Test It Out | Present it to someone unfamiliar with the process for feedback. Their input can reveal unclear parts. |
| 8 | Use Labels & Descriptive Text | Each symbol should have concise and clear text describing actions or decisions. Label outgoing arrows for decisions with potential outcomes (“Yes,” “No”). |
| 9 | Leave Enough White Space | Avoid overcrowding; white space enhances readability and emphasizes elements. |
| 10 | Keep Iterating | Flowcharts, like processes, can evolve. Revisit and refine them as needed. |
| 11 | Use Technology to Your Advantage | Digital tools offer precision, easy editing, and sharing. Familiarize yourself with platforms like Lucidchart, Microsoft Visio, or Draw.io. Templates can guide layout. |
| 12 | Be Consistent | Maintain consistency in symbols, color schemes, and text fonts, especially when creating a series of flowcharts for a project or team. |
FAQs
Why is defining a clear objective important?
Defining a clear objective ensures that your flowchart stays focused. It helps in determining the scope of what you’re illustrating, preventing unnecessary complexities or deviations. With a set objective, you can align your flowchart directly with the information needs of your intended audience.
I see many different symbols used online. Do I have to stick to the standard ones?
While various symbols can be found in different flowcharts, sticking to standard symbols is advisable, especially if the flowchart is for a wider audience. This is because standard symbols are universally recognized, which aids in clarity and prevents misinterpretation.
How do swim lanes enhance readability?
Swim lanes segregate tasks or steps based on certain criteria, like departments or individuals. They provide visual categorization, making it easier to follow who does what or what happens where. This structure can make a complex process with multiple stakeholders much clearer.
If my flowchart is digital, why should I care about it being legible in grayscale?
Accessibility is key. Grayscale legibility ensures that individuals with color vision deficiencies can understand the chart. Additionally, if your flowchart is printed in black and white, it retains its clarity.
Are there situations where a hand-drawn flowchart might be more advantageous than a digital one?
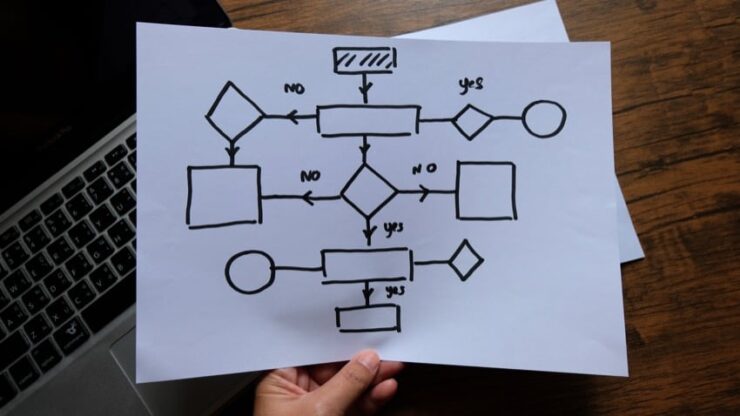
Absolutely! Hand-drawn flowcharts are excellent during brainstorming sessions, workshops, or meetings where instant changes and collaboration are required. They provide flexibility and immediacy, although they might lack the polish and precision of a digital chart.
Conclusion
Crafting the perfect flowchart is not merely about drawing shapes and connecting arrows; it’s an art that melds clarity with complexity, ensuring processes are both detailed and digestible. As processes evolve and teams expand, the value of a well-designed flowchart becomes increasingly evident. It bridges communication gaps, facilitates understanding, and streamlines decision-making.
By heeding the insights from the FAQs and applying the provided tips and tricks, anyone can harness the power of flowcharts, turning intricate procedures into clear, visual narratives that benefit entire organizations. Whether digital or hand-drawn, in color or grayscale, the essence of a successful flowchart lies in its ability to communicate efficiently and effectively.
